
Updated October 1, 2026
Search for the Boulder housing market right now, and you can find several very different-looking answers.
Realtor.com's September 2026 data shows a $910,000 median sold price in Boulder, down 8.5% from a year earlier. Zillow, however, estimates the typical Boulder home value at $948,693, up 0.9% year over year through August. Redfin's latest three-month measure puts Boulder's median sale price at about $974,355, up 8.3% from the comparable period a year earlier.
Those figures seem contradictory.
They are not necessarily.
Each company measures the housing market differently, and in Boulder the mix of properties that sell during a particular month can have an unusually large effect on the headline median. A downtown condo, a North Boulder townhome, a detached home near the foothills, and a luxury property west of Broadway can all occupy very different price ranges while still being counted as part of the same Boulder market.
So, are Boulder home prices actually falling?
Some measurements show clear year-over-year price declines, while others show relatively stable or increasing values. The more useful takeaway for October 2026 is that Boulder has become a more price-sensitive market where buyers have meaningful negotiating opportunities—but conditions still vary considerably by property type, neighborhood, price range, and the quality of the individual listing.
Here is what the latest numbers mean.
Boulder Housing Market at a Glance — October 2026
The freshest complete monthly figures currently available from Realtor.com cover September 2026, making them a useful starting point for an October market update.
| Market measure | September 2026 | Year-over-year change |
|---|---|---|
| Median listing price | $1,049,000 | -4.77% |
| Median sold price | $910,000 | -8.50% |
| Median listing price per sq. ft. | $546 | -1.44% |
| Active listings | 903 | +0.21% |
| Median days on market | 64 days | -10.15% |
| Sale-to-list ratio | 97% | — |
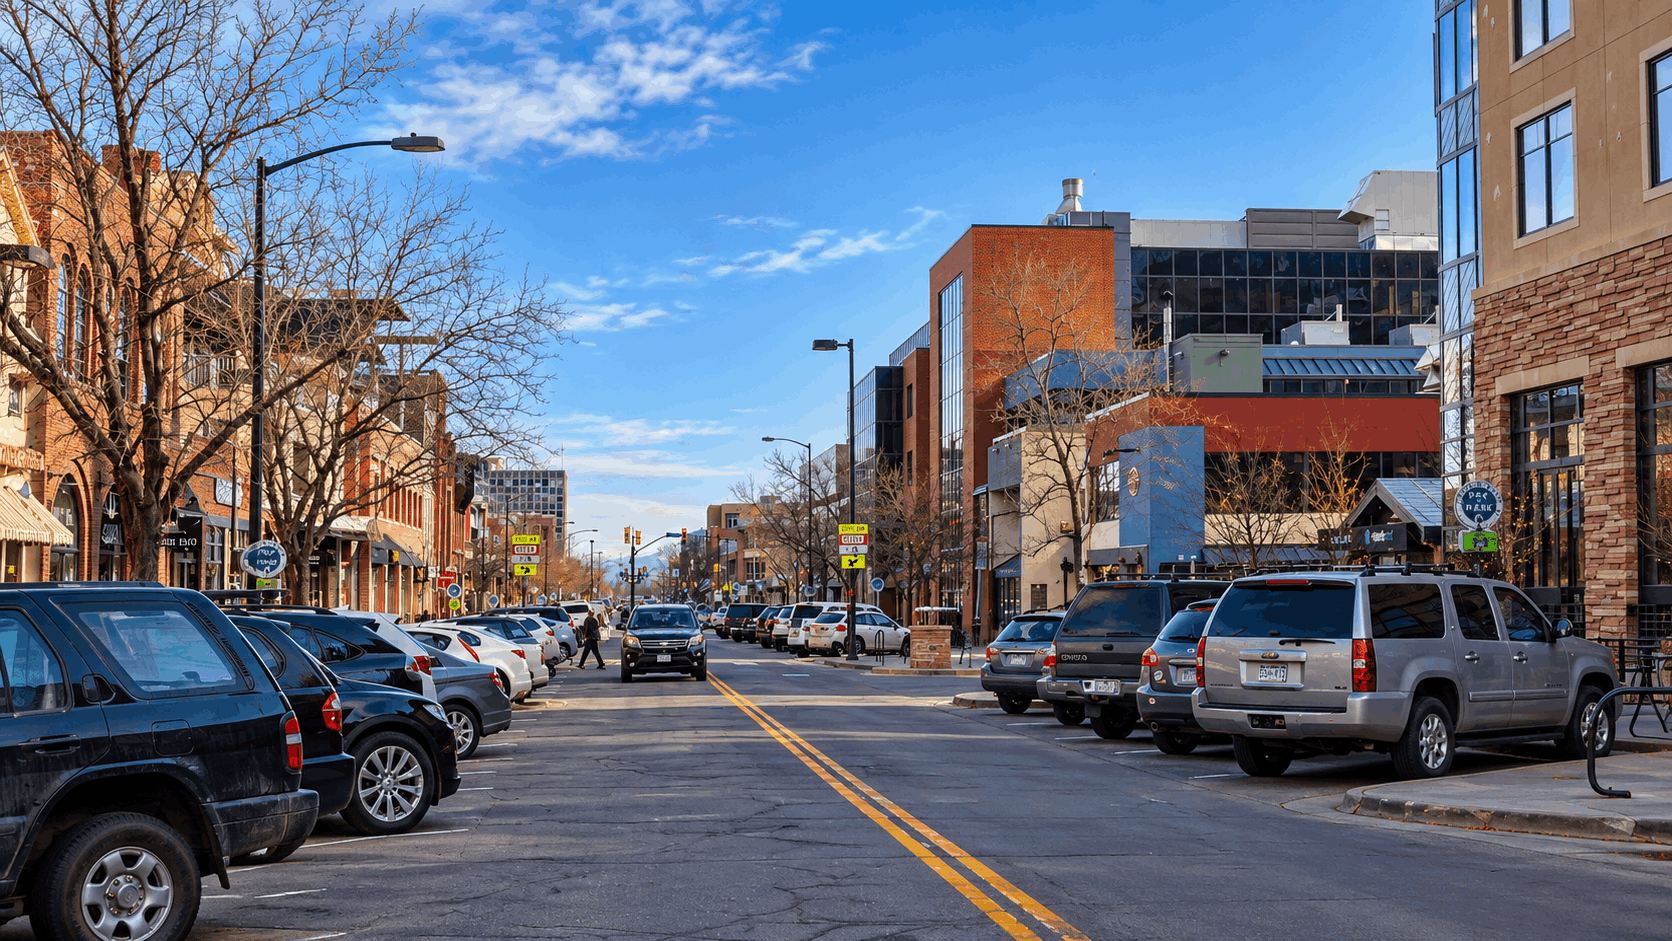
Realtor.com classified the City of Boulder as a buyer's market in September 2026, meaning that its measure of housing supply was greater than demand. Homes sold for an average of approximately 2.67% below asking price, producing a 97% sale-to-list ratio.
There is an important wrinkle in those numbers.
The median sold price was substantially lower than a year earlier, yet homes were actually spending less time on the market. The median 64-day market time was down more than 10% year over year, while the number of active listings was almost unchanged.
That is different from a market where inventory is rapidly piling up because buyers have disappeared.
Instead, it points toward a market where pricing has become increasingly important.
A home that enters the market close to what buyers believe it is worth can still move relatively efficiently. A property that starts significantly above comparable sales may face a different outcome: fewer showings, additional days on market, price reductions, or stronger negotiation from buyers.
That distinction is one of the most useful things buyers and sellers can take from the October numbers.
Are Boulder Home Prices Actually Falling?
Using Realtor.com's September closed-sale measure, the answer is straightforward: Boulder's $910,000 median sold price was 8.5% lower than it was a year earlier. The median listing price also declined 4.77% year over year.
But that does not mean the typical Boulder homeowner necessarily lost 8.5% of their property's value.
Zillow's Home Value Index tells a considerably different story.
As of August 31, Zillow estimated the typical Boulder home value at $948,693, representing a 0.9% year-over-year increase. Zillow also reported 769 homes in for-sale inventory and a median 32 days from listing to pending.
Redfin provides another perspective. Its three-month data through August 2026 shows a $974,355 median sale price, up 8.3% from the comparable period a year earlier. Redfin also reports a 97.2% sale-to-list ratio and roughly 60 days on market.
So which number is correct?
Potentially all three.
The key is understanding what they measure.
A monthly median sale price is the midpoint among properties that actually sold during a particular period. If one month contains more condos and smaller properties—or fewer multimillion-dollar detached homes—the citywide median can decline even without every individual home's value falling by the same percentage.
Zillow's Home Value Index works differently. Zillow describes the ZHVI as a measure built from changes in property-level Zestimate values across housing types rather than simply taking the median of that month's closed transactions.
Redfin's current headline statistic uses a rolling three-month period, which can smooth some of the volatility found in one month of closings.
That is why a homeowner should be cautious with headlines such as “Boulder home prices fell 8.5%.”
The statistic is real. The assumption that every Boulder home therefore lost 8.5% is not.
Why Boulder Housing Statistics Can Look So Different
There is no single uniform Boulder real estate market.
Instead, Boulder contains overlapping markets divided by neighborhood, property type, condition, lot characteristics, views, HOA structure, proximity to amenities, and price range.
Even ZIP-code-level statistics show how dramatically conditions can differ.
In September 2026, Realtor.com reported a $1,162,500 median sold price in ZIP code 80302, down only 0.64% year over year. In 80303, the median sold price was $688,750, down 10.55% from a year earlier.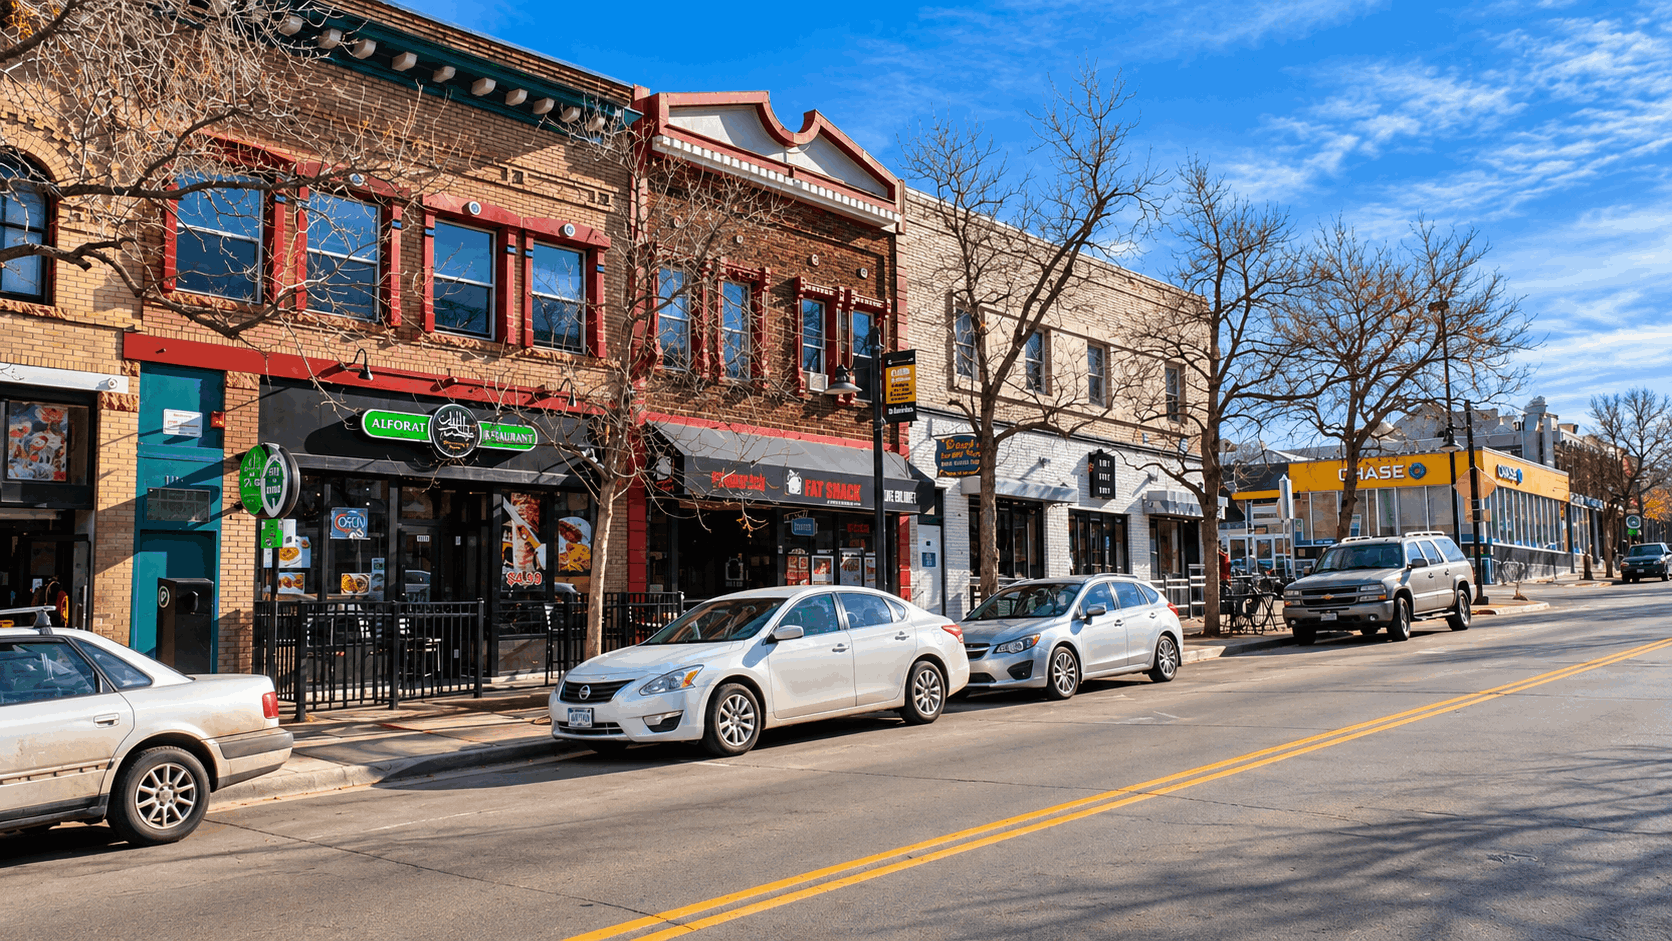
Those figures are not property valuations, and smaller geographic areas can experience larger statistical swings when relatively few transactions occur.
But they demonstrate the problem with treating one Boulder-wide number as though it describes every home.
Property type creates another layer.
A condo near CU Boulder or Boulder Junction should not automatically be evaluated against a citywide statistic heavily influenced by detached-home sales. Likewise, a renovated single-family property near central Boulder may compete against a very different buyer pool from an attached property on the eastern side of the city.
Zillow's current ZIP-level estimates show the same degree of variation in typical values. Its August figures ranged from approximately $700,614 in 80301 to more than $1.22 million in 80304, while 80302 was approximately $1.10 million.
For homeowners, broad market statistics help explain the direction of the market.
For an actual selling or buying decision, recent comparable properties that match the home's location, property type, condition, size, lot characteristics, and price range are far more useful.
What the October 2026 Market Means for Boulder Buyers
For buyers, one of the clearest changes in the current Boulder market is negotiating room.
Realtor.com's September figures show Boulder homes selling for about 97% of their asking price on average. Zillow's most recently available sale-distribution data, from July, shows that 63.3% of tracked sales closed below asking price, compared with 17% that closed above asking. Redfin reports a similar 97.2% sale-to-list ratio and says 37.7% of Boulder homes experienced a price drop in its latest three-month data.
That does not mean buyers should automatically offer 3% below asking on every property.
It means they have more reason to investigate the individual listing.
A home that has been available for several weeks, undergone a price reduction, or entered the market above recent comparable sales may create a very different negotiating situation from a well-prepared property that was priced accurately from day one.
Buyers should look at:
- Current asking price versus recent comparable sales
- Original asking price and any price reductions
- Days on market
- Property condition and known repair needs
- Whether similar listings are available nearby
- Seller timing or possession requirements
- HOA costs and documents for attached housing
- Insurance availability and cost
- Flood or wildfire considerations when relevant
- Financing costs and the complete monthly payment
Mortgage rates make that last point especially important.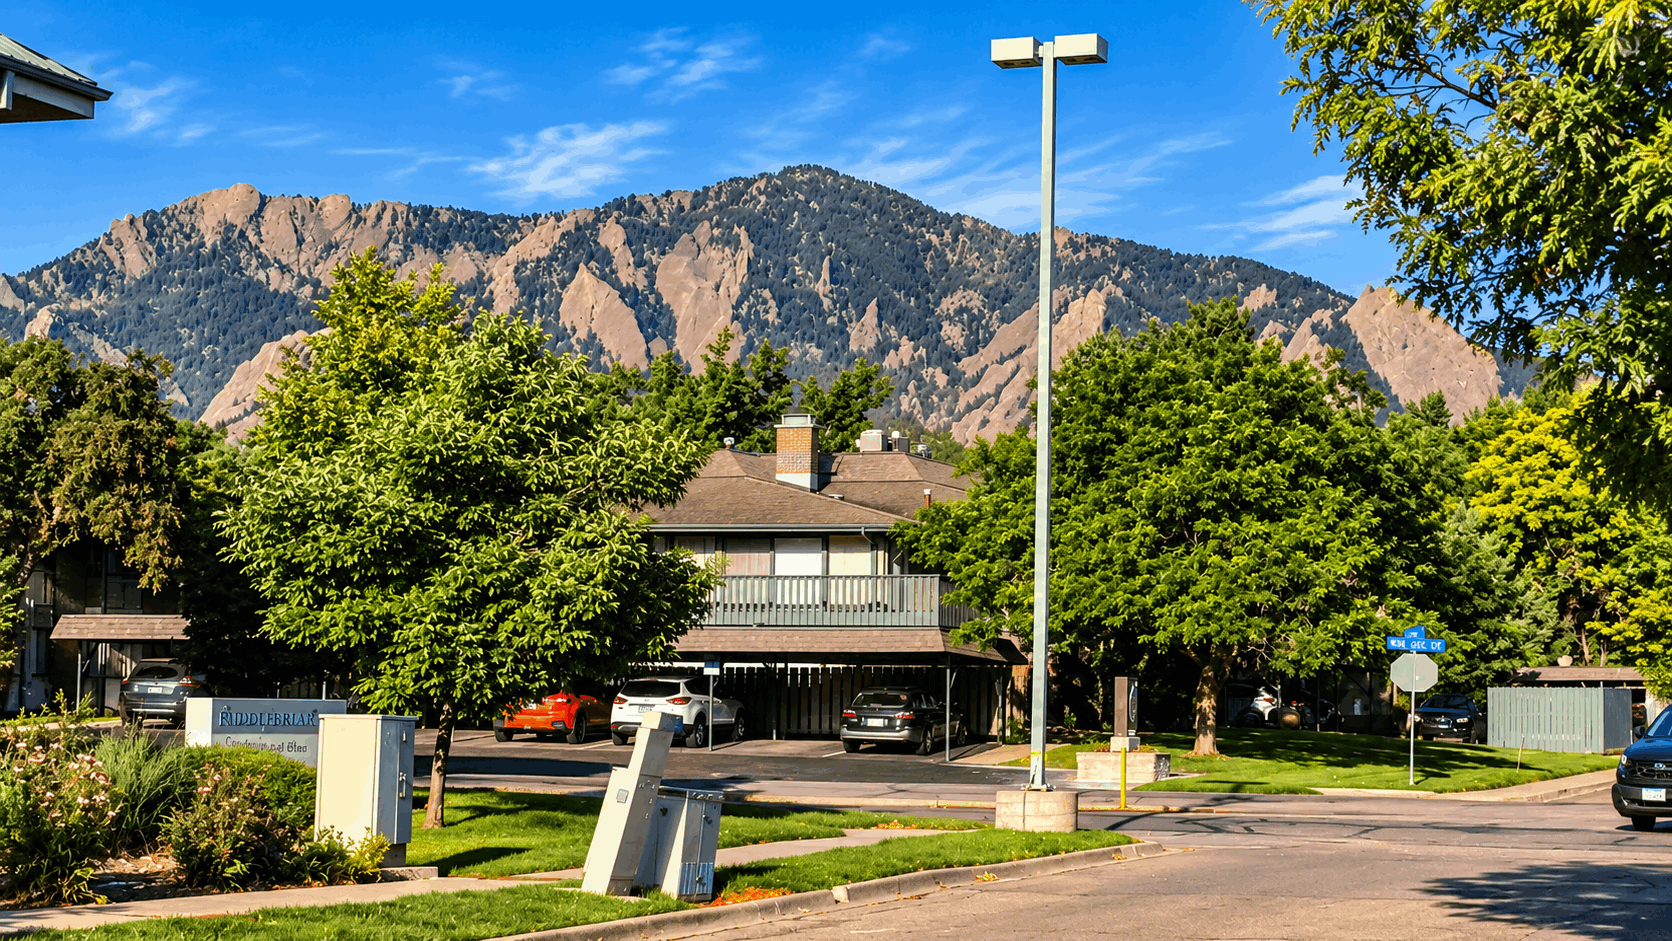
Freddie Mac's latest published Primary Mortgage Market Survey available at the time of this article shows the average 30-year fixed mortgage rate at 7.03% as of September 24, 2026, up from 6.30% a year earlier. Freddie Mac releases its survey on Thursdays, so buyers should check the latest rate when running an actual affordability calculation.
A lower purchase price does not automatically mean a lower monthly cost if borrowing costs have increased.
That is why buyers should compare the full property-specific payment rather than shopping by price alone.
For a deeper affordability calculation, see How Much Income You Need to Buy a Home in Boulder. That guide explains how the mortgage, taxes, insurance, HOA dues, down payment, and debt-to-income ratio work together.
Condo and townhome buyers should also review Boulder Condo & Townhome Buyer Guide: HOA Fees, Insurance & More before treating a lower purchase price as automatically more affordable.
What the October 2026 Market Means for Boulder Sellers
For sellers, today's market increases the importance of getting the first asking price right.
Boulder's median listing price was $1.049 million in September, while the median sold price was $910,000. Those are not directly comparable measures of the exact same houses, but combined with the 97% sale-to-list ratio and widespread price reductions reported by other sources, they reinforce one practical point: buyers are paying close attention to value.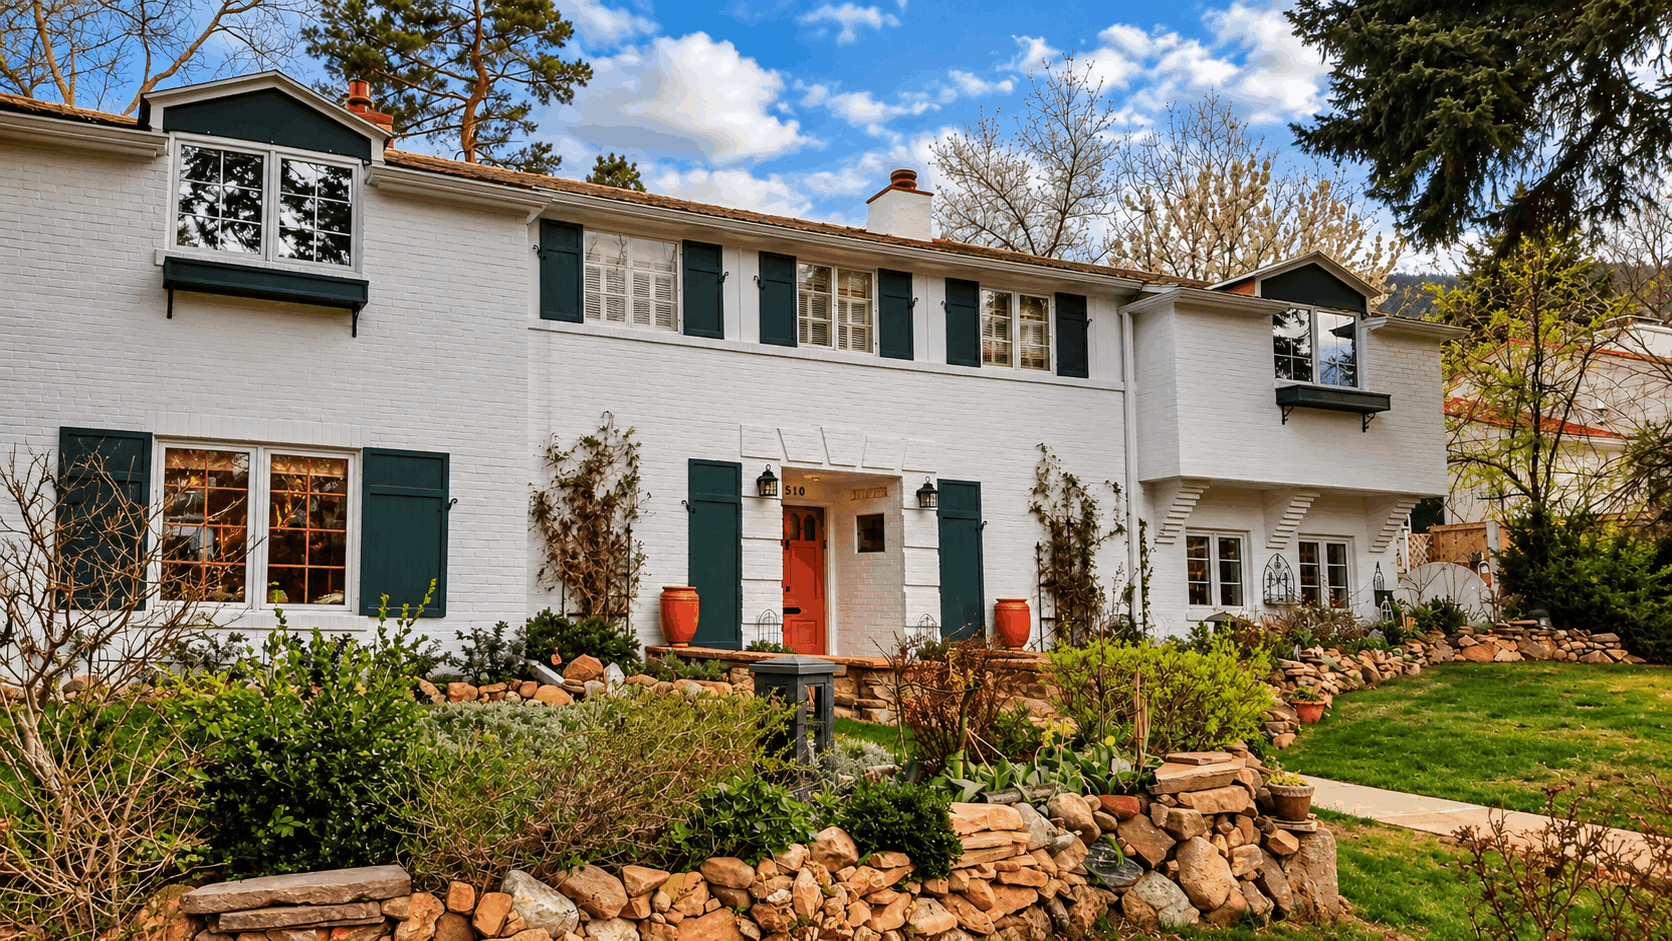
A seller does not need to price a home artificially low.
But the list price should be defensible.
The strongest comparison set is usually built around recent properties that genuinely resemble the home: similar location, housing type, condition, square footage, lot characteristics, renovation level, parking, views, and other features buyers are likely to compare.
Overpricing can be particularly costly when buyers have alternatives.
The first days of a listing generally provide the strongest opportunity to attract buyers who are actively monitoring new inventory. If those buyers conclude that a home is priced substantially above competing properties, lowering the price several weeks later does not recreate that initial launch.
Presentation matters for the same reason.
When buyers have more choices, deferred maintenance, poor listing photography, cluttered interiors, unfinished repairs, or unclear property information become easier to compare with competing homes.
Sellers should also separate two questions:
What would I like the home to sell for?
and
What price does the current market support?
A citywide median cannot answer the second question by itself.
A property-specific analysis of current competition, recently sold homes, pending transactions where information is available, and the property's actual condition is much more useful.
Boulder Is Not the Same Market as Boulder County
This distinction is especially important for relocation buyers searching online.
In September 2026, Realtor.com reported a $910,000 median sold price for the City of Boulder.
For Boulder County as a whole, the median sold price was $700,000. The county's median listing price was approximately $795,450 compared with $1.049 million inside the city.
Boulder County includes markets such as Longmont, Louisville, Lafayette, Superior, Niwot, Lyons, Nederland, Gunbarrel, and unincorporated areas in addition to the City of Boulder.
Those locations do not behave as one interchangeable real estate market.
For example, Realtor.com's September median listing prices included approximately:
- Boulder: $1,049,000
- Longmont: $585,000
- Lafayette: $692,450
- Superior: $770,000
- Louisville: $899,000
- Niwot: $1,699,500
The numbers are useful for understanding the scale of the differences, but buyers should still compare actual homes rather than selecting a community solely from its median.
A lower-priced market may involve a different commute, housing stock, HOA structure, property tax situation, lot size, school boundary, transportation network, or lifestyle.
The market classifications differ as well.
Realtor.com identified the City of Boulder as a buyer's market in September, while it classified Boulder County overall as balanced, meaning its countywide measure of supply and demand was roughly even.
What to Watch Through the End of 2026
One month of data should not be treated as a forecast.
The more useful approach is to watch several indicators together through the remainder of the year:
inventory, days on market, price reductions, sale-to-list ratios, mortgage rates, and how quickly correctly priced homes receive acceptable offers.
For example, lower prices accompanied by rapidly increasing inventory and substantially longer selling times would signal something different from lower prices accompanied by stable inventory and quicker sales.
At the moment, Realtor.com's September figures show lower prices, essentially flat year-over-year inventory, and shorter median market time.
That is why simple descriptions such as “Boulder is crashing” or “Boulder is still booming” miss much of what is happening.
The current market is better described as more selective.
Buyers are paying attention to value and financing costs. Sellers who price accurately can still attract serious buyers. And results can differ considerably from one Boulder neighborhood or property type to another.
For additional context on how new housing supply could affect different parts of the city over time, see Bold Redevelopment Projects Reshaping Boulder in 2026.
Boulder Housing Market FAQ
What is the median home price in Boulder right now?
Realtor.com reports a $910,000 median sold price in Boulder for September 2026, along with a $1.049 million median listing price. Zillow's different Home Value Index estimates the typical Boulder home value at $948,693 through August 2026. Those metrics measure different things and should not be treated as interchangeable.
Are Boulder home prices dropping in 2026?
Some measurements show declines. Realtor.com's September median sold price was down 8.5% year over year. However, Zillow's typical home value was up 0.9% through August, and Redfin's three-month median was up 8.3%. The differences reflect methodology, time period, and the mix of homes included in each dataset.
Is Boulder a buyer's market in October 2026?
The most recent full monthly data is for September. Realtor.com classified the City of Boulder as a buyer's market in September 2026, meaning its measure of available supply exceeded demand. That is a broad citywide classification and does not mean every property favors the buyer.
How long does it take to sell a home in Boulder?
Realt.com's September figures show a 64-day median time on market. Redfin's latest rolling data shows approximately 60 days. Zillow uses a different measure—time from listing to pending—and reported a median of 32 days through August.
Are Boulder homes selling below asking price?
On average, yes according to the latest broad market measures. Realtor.com reports a 97% sale-to-list ratio, while Zillow's July data shows 63.3% of tracked sales closing below list price. Results vary substantially by individual property.
Is the Boulder housing market the same as Boulder County?
No. Realtor.com's September median sold price was $910,000 in the City of Boulder and $700,000 across Boulder County. Boulder County includes several communities with different prices, housing types, and market conditions.
Should I wait for Boulder home prices to fall before buying?
There is no single market statistic that can determine the right timing for an individual buyer. Purchase price, interest rate, expected time in the home, available inventory, income, down payment, property condition, taxes, insurance, HOA costs, and personal plans all affect the decision.
A buyer who finds a suitable property with manageable ownership costs may reach a different conclusion from someone who expects to move again within a short period.

FROM OUR BLOG


Family-Friendly Things to Do in Boulder: Parks, Trails & More
Boulder is often associated with serious hiking, climbing, and cycling, but experiencing the city with children does not require turning every outing into an endurance event. Some of Boulder's most useful family activities are much simpler: a playground beside a multi-use path, a short walk around a

Pearl Street Mall Guide: Where to Eat, Shop, and People-Watch
Pearl Street Mall is one of the easiest places to start understanding Boulder, but there is an important distinction first-time visitors often miss: the pedestrian mall itself is only four blocks, from 11th Street to 15th Street. Downtown shopping and dining continue east and west well beyond those

Boulder Without a Car: Walkable, Bikeable, and Transit-Friendly Things to Do
If you are considering Boulder without a car, the useful question is not simply, “Is Boulder walkable?” It is whether the places you actually use can be connected comfortably by walking, biking, and transit from a specific address. Boulder gives car-free and car-light residents more infrastructure t